Custom Business Intelligence
Software Development
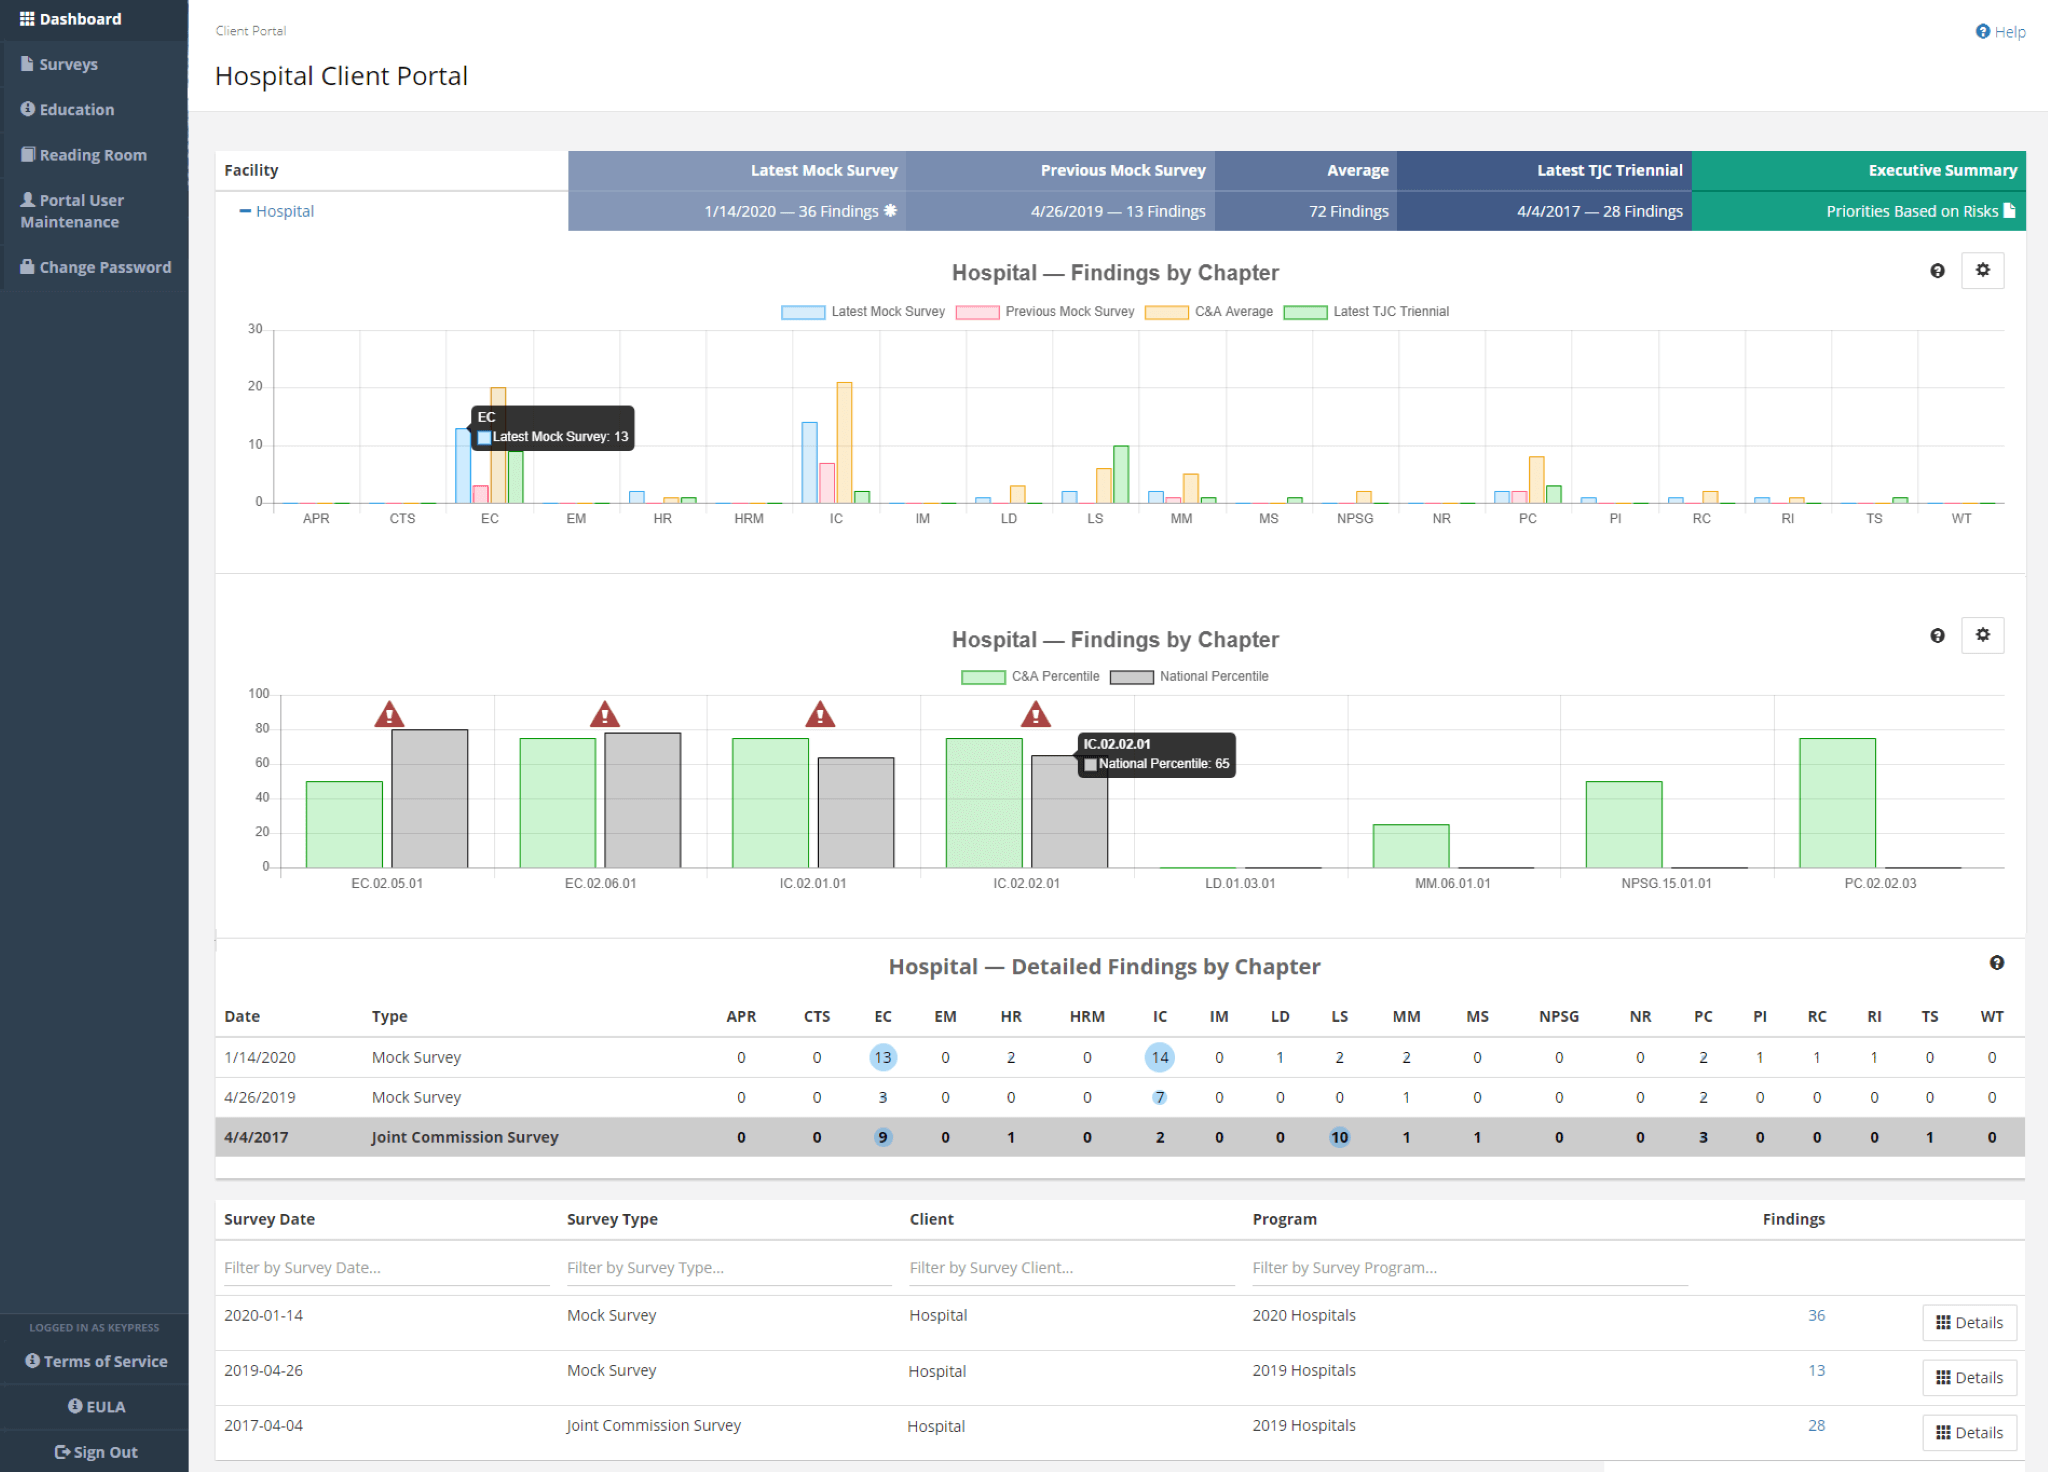
Informed decisions enabled by data visualization
How we can help
- Key Performance Indicator growth/decline signal monitoring (e.g. gross revenue, average unit price, top products by profit/units, customer trending, staff efficiency/profitability)
- Automated Data Insights – automatically comb through gigabytes of data to identify important trends. Data insights can be displayed with widgets, graphs, charts, reports and more.
- Live Charts & Graphs for informed decisions – executive summary for day / week / month / quarter / year.
- Interactive Widgets – interact and play with the widget data when you need a human touch to identify the main takeaway
- Critical Goal Tracking dashboard modules – identify & correct shortcomings. Focus & amplify strengths.
- Customized Reporting – sort, filter and group your reports to highlight the significance – flexible reporting that doesn’t lock you into a preset mold.
Capabilities
- KPI calculation & widget development
- Live Charts & Graphs development
- Interactive widget development
- Real-time Employee Progress Tracking dashboard module development
- Dashboard development – management dashboards, internal communication dashboards
- Custom Report Generation
- Portal development – customer portals, mobile technician portals, department portals, production portals
- Platforms: Azure, Amazon Web Services (AWS), Windows
- Enhanced UI (User Interface) design
- Web app development for mobile devices
- Primary Languages: HTML, ASP.Net, C#.Net, VB.Net, Javascript, JQuery, React, CSS


 © 2024 Keypress Group PC